Blog
The Real Payback Math of a Fry Station Cobot (With a Worksheet You Can Fill In)
ArmMate
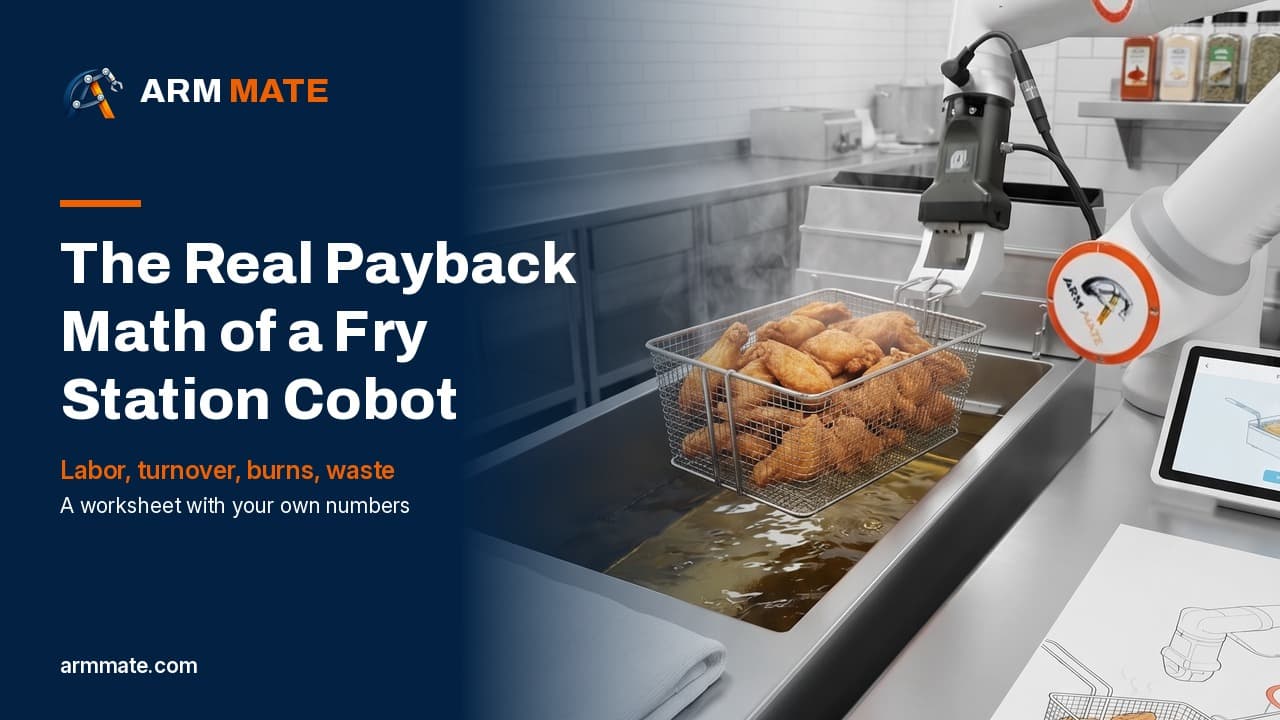
Every fry station automation pitch ends with a payback number. Most of them are built on someone else's labor rate, someone else's turnover, and someone else's kitchen. This article gives you the inputs that matter, where to find a fair benchmark for each one, and a worksheet you can fill in with your own numbers before you talk to any vendor, including us.
Why the fryer is the right place to run the math
The fry station is where labor, turnover, and injury risk stack up in one spot.
OSHA's restaurant safety guidance warns that workers are especially at risk of burns while cooking with or cleaning deep fat fryers, from contact with the fryer, splashing oil, and straining or moving oil. (OSHA: https://www.osha.gov/etools/young-workers-restaurant-safety/cooking)
Burns are not rare or cheap. AmTrust's 2024 Restaurant Risk Report, built on six years of restaurant workers' compensation claims (2018 to 2023), lists 13,331 burn claims with an average cost of $4,326 per claim. (AmTrust: https://www.amtrustfinancial.com/getmedia/2bb9bd0b-c847-411c-b16b-93a09c52b08b/Restaurant_Risk_Report.pdf)
New hires carry a big share of that risk. Travelers' 2026 Injury Impact Report found first-year employees account for 51% of injuries in restaurants. (Travelers: https://investor.travelers.com/newsroom/press-releases/news-details/2026/Travelers-Injury-Impact-Report-Highlights-Longer-Recovery-Times-Amid-Declining-Injury-Rates/default.aspx)
And restaurants hire constantly. In 2025, the quits rate in accommodation and food services averaged 4.2% of employment every month, the highest of any industry BLS tracks and more than double the 2.0% all-industry average. (BLS JOLTS: https://www.bls.gov/news.release/jolts.t22.htm)
Put those together and the fry station is a station you are always re-staffing, often with new people, in front of hot oil. That is why the payback case is about more than wages.
The four buckets of value
1. Labor hours you actually take off the schedule
This is the biggest number and the easiest one to inflate. A cobot doing basket work only saves money if those hours come off the schedule, cover a shift you cannot fill, or replace overtime. If the same person stands next to the robot all day, the labor savings are zero.
Start with an honest count: how many hours per day is someone dedicated to dropping, timing, shaking, and pulling baskets? Then decide how many of those hours you would really remove or redeploy.
Use your fully loaded hourly cost, not just the wage. In accommodation and food services, wages and salaries make up 80.8% of total employer compensation, so the loaded cost is roughly your wage divided by 0.808. (BLS Employer Costs for Employee Compensation, June 2026: https://www.bls.gov/news.release/ecec.t04.htm)
Benchmarks if you need one: the national mean wage for restaurant cooks was $18.62 an hour in May 2025, and $15.57 for fast food cooks. (BLS OEWS, Cooks, Restaurant: https://www.bls.gov/oes/2025/may/oes352014.htm and Cooks, Fast Food: https://www.bls.gov/oes/2025/may/oes352011.htm) In California, covered fast food restaurants must pay at least $20.00 an hour. (California DIR: https://www.dir.ca.gov/dlse/Fast-Food-Minimum-Wage-FAQ.htm)
2. Turnover and rehiring
Every time the fry position turns over you pay for job ads, interview time, paid training shifts, and a stretch of slower, less consistent output while the new person learns. In a study of U.S. hotels, Cornell's Center for Hospitality Research found that lost productivity from new employees' inexperience is the single biggest contributor to the cost of turnover. (Cornell CHR: https://scholarship.sha.cornell.edu/chrpubs/149)
Use your own number here. Add up recruiting spend, manager hours, and paid training hours for your last few fry station hires. Then estimate how many of those hires you would avoid if the hottest, most repetitive part of the job moved to a robot.
3. Burns and workers' comp
The AmTrust average of $4,326 per burn claim is a reasonable starting point, but it is only the direct claim. Claims also feed your experience modifier, which affects future premiums, and every injury means a short-staffed shift.
Be conservative. Do not assume a robot eliminates every burn in the kitchen. Count only the incidents tied to basket work at the fryer, and look at your own injury log for the last three years.
4. Consistency and waste
A programmed cobot drops and pulls on the same timer every time. That shows up as fewer over-fried or under-fried baskets, fewer re-fires, and more predictable oil and product use. This is the hardest bucket to measure before you automate, so use a small daily number based on what you throw away today, and track it after install.
The worksheet, with a worked example
This is an example with assumed inputs, not a quote or a promise. Replace every assumption with your own numbers.
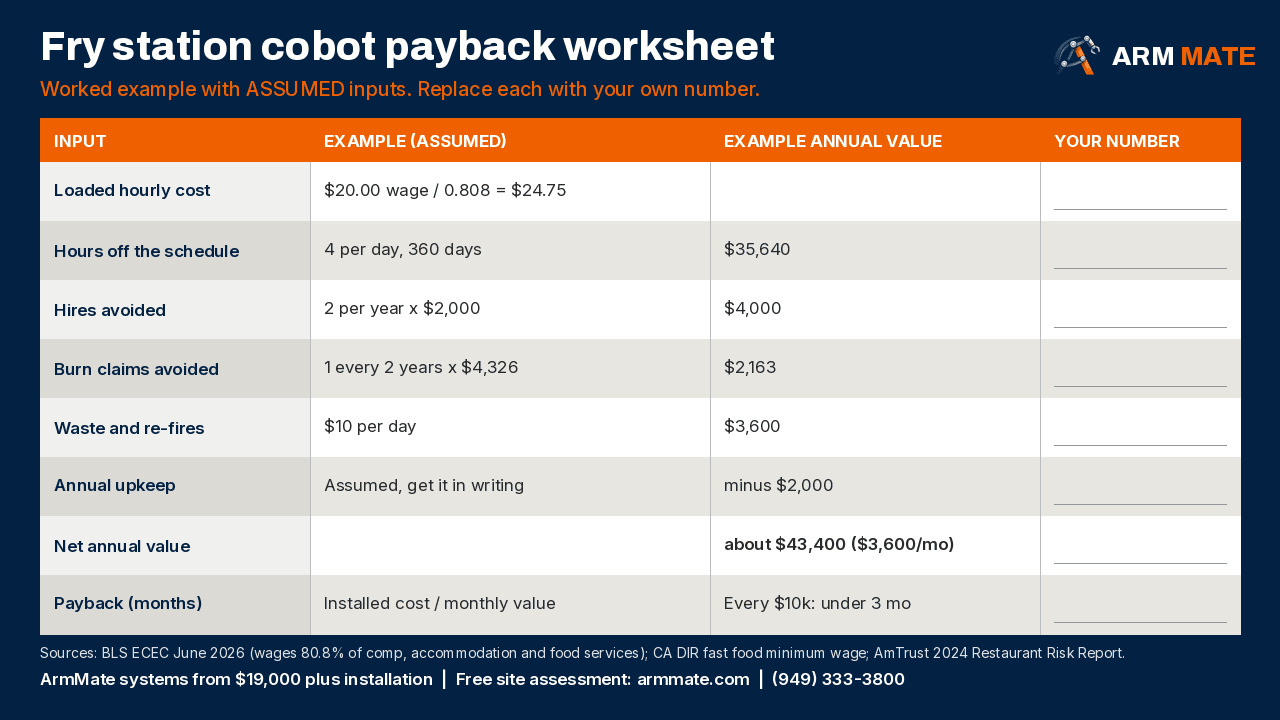
Example assumptions (California fast food kitchen, open 360 days a year):
- Wage: $20.00 an hour (California fast food minimum). Loaded at 80.8%, that is about $24.75 an hour.
- Fry station hours actually taken off the schedule: 4 per day.
- Fry station hires avoided: 2 per year, at an assumed $2,000 each in recruiting, training hours, and lost productivity.
- Burn claims avoided: 1 every two years, at the AmTrust average of $4,326.
- Waste and re-fires avoided: $10 per day.
- Annual upkeep for the robot (service, wear parts, your team's time): an assumed $2,000. Ask any vendor to put their real number in writing.
The math:
- Labor: 4 hours x $24.75 x 360 days = $35,640
- Turnover: 2 x $2,000 = $4,000
- Burns: $4,326 / 2 = $2,163
- Waste: $10 x 360 = $3,600
- Less upkeep: minus $2,000
- Net annual value: about $43,400, or about $3,600 a month
Payback in months = total installed cost / monthly net value. In this example, every $10,000 of installed cost pays back in under three months. ArmMate systems start from $19,000 plus installation. In this example, that starting system price would be covered in a little over five months, with installation on top.
Now the conservative case. Same kitchen, but only 2 hours a day come off the schedule, only 1 hire is avoided, burns are not counted at all, and waste savings are $5 a day. Net annual value drops to about $19,600, roughly $1,600 a month, and the same starting system price takes just under 12 months to cover, with installation on top.
That spread is the point. If your case only works with the optimistic inputs, slow down. If it still works with the conservative ones, you have a real project.
What not to count
- Hours that do not leave the schedule. If no one's shift changes, there is no labor saving.
- Capacity the fryers do not have. A cobot makes the station consistent. It does not add vats.
- Savings at sites that cannot support a safe working zone. If the arm cannot work without crowding staff or blocking a path, fix the layout first.
Questions to ask any vendor
- What is the total installed cost, and what is the annual upkeep in writing?
- Do I own the robot, or am I renting it?
- Can it use my existing baskets and fryers?
- What happens when the menu changes? Who reprograms it, and what does that cost?
- How is the safe working zone set up around my crew?
The bottom line
A fry station cobot is a capital decision, so treat it like one. Use your loaded labor rate, your turnover, your injury history, and a conservative view of the hours you will really remove. If the numbers work on paper, the next step is to confirm them on site.
Book a free fry station site assessment. We will walk your line, check your fryers and layout, help you fill in this worksheet with your real numbers, and tell you straight whether the project pencils out.
Book at armmate.com (https://armmate.com).
hello@armmate.com | (949) 333-3800 | armmate.com (https://armmate.com)
ArmMate, 15642 Sand Canyon, Irvine, CA 92618
Worked example uses assumed inputs. Benchmarks are from the public sources below as of October 20, 2026.
Sources
- OSHA, Young Worker Safety in Restaurants: Cooking. https://www.osha.gov/etools/young-workers-restaurant-safety/cooking
- AmTrust Financial, 2024 Restaurant Risk Report (workers' compensation claims 2018 to 2023). https://www.amtrustfinancial.com/getmedia/2bb9bd0b-c847-411c-b16b-93a09c52b08b/Restaurant_Risk_Report.pdf
- Travelers, 2026 Injury Impact Report press release. https://investor.travelers.com/newsroom/press-releases/news-details/2026/Travelers-Injury-Impact-Report-Highlights-Longer-Recovery-Times-Amid-Declining-Injury-Rates/default.aspx
- U.S. Bureau of Labor Statistics, JOLTS Table 22, Annual average quits rates by industry. https://www.bls.gov/news.release/jolts.t22.htm
- U.S. Bureau of Labor Statistics, Employer Costs for Employee Compensation, Table 4, June 2026. https://www.bls.gov/news.release/ecec.t04.htm
- U.S. Bureau of Labor Statistics, OEWS May 2025, Cooks, Restaurant (35-2014). https://www.bls.gov/oes/2025/may/oes352014.htm
- U.S. Bureau of Labor Statistics, OEWS May 2025, Cooks, Fast Food (35-2011). https://www.bls.gov/oes/2025/may/oes352011.htm
- California Department of Industrial Relations, Fast Food Minimum Wage FAQ. https://www.dir.ca.gov/dlse/Fast-Food-Minimum-Wage-FAQ.htm
- Cornell Center for Hospitality Research, "The Costs of Employee Turnover: When the Devil Is in the Details" (2006). https://scholarship.sha.cornell.edu/chrpubs/149